How I Debug Poor Performance - Network

Performance should be one of the top things any engineer should consider when pushing things to production. You can have best UI and fanciest animation in your app but if performance is bad like it takes long time to load, probably nobody would notice your killer app and that would be a shame.
In this post, let's focus on Network. What network means here is the time it takes for the actual transfer of the files necessary to present your app. Sometimes it can be a physical obstacle like bad internet but sometimes it's just too much stuffs being shipped at the same time. We cannot fix the internet that people have but we can fix our app.
Tool
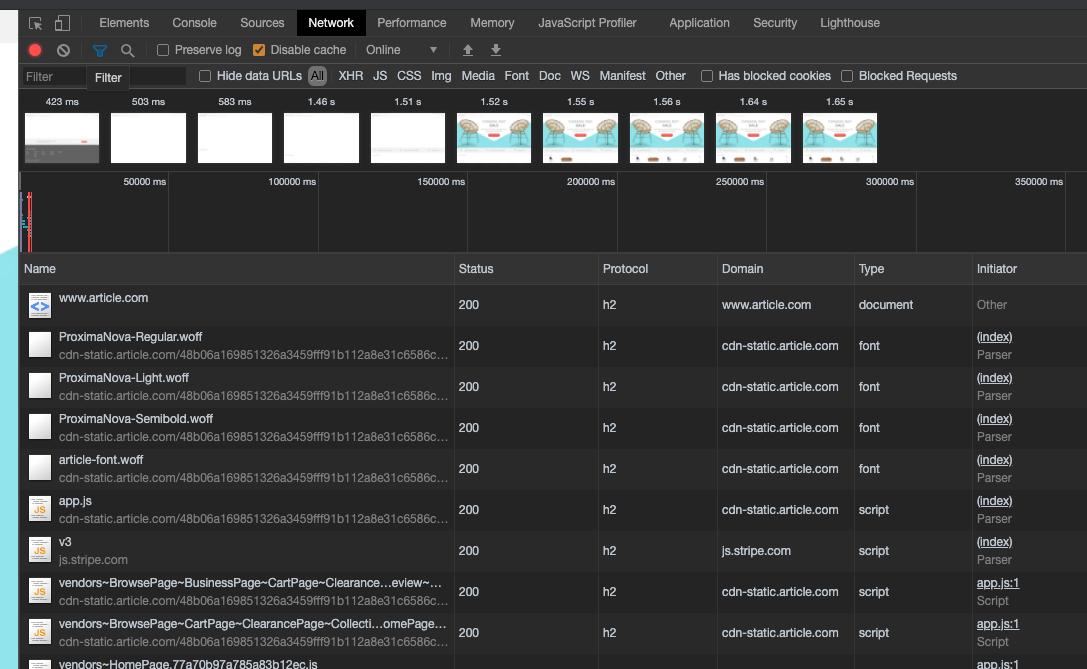
Most browsers nowadays have a Network tab in their respective devtool. This shows you everything that browser has downloaded when visiting a website. It shows you the request in the order of being downloaded, who tried to download it, their size, download time. It has a lot of details, but can also be lost in it.

Here I'm going to use Chrome and I of course will not judge you if you are using IE to debug. In fact, I will admire you.
The Network

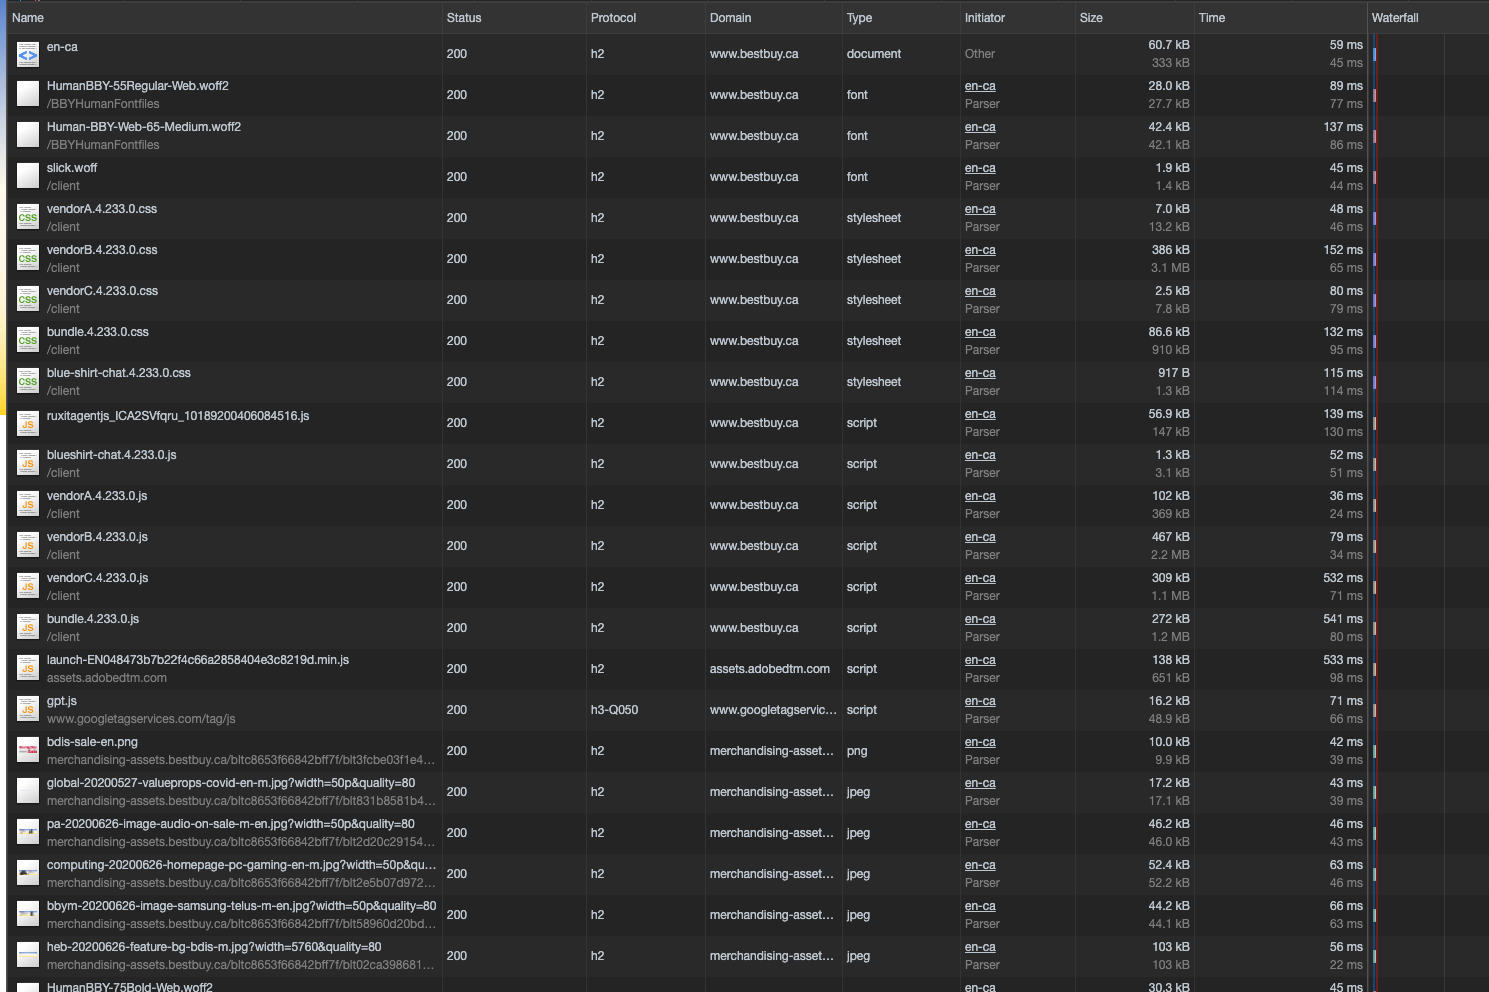
When I open the network tab, there are a lot of information here. We see here when we land on BestBuy, it's downloading the necessary fonts, CSS files, JavaScripts, and then the images shown on the page. By default it is shown in the order of when requests are fired and each row has some info about each request.
Protocol
This denotes what protocol the request is using to transfer these files. For a standard website we will mostly see if it's http 1.1 or h2 as shown above. The main difference between these 2 protocols are that h2 by default allows you to request multiple files simultaneously. In plain language, it means your browser can download multitple files at the same time instead of when in http 1.1 you can only downlaod 1 file at a time. Although browsers would do some smart things but it's not as effective as h2. The performance tip before h2 is here was to use webpack or gulp to concatenate all of your files into 1 file so we have less overhead. Nowadays most browsers, servers, and CDN use h2 by default. I see gpt.js is using h3, getting adventurous here.
Initiator
It is basically telling you who started this request. It can be from HTML, or a method in JavaScript. It is very good for understanding how these requests happened.
Size
This is self-explanatory: the actual file size that the browser has downloaded. If it's only 1 number, then it is the size that browser has downloaded but if it shows 2 numbers then the top one if the download size, the bottom number is the size after uncompressing the file. It may sometimes show it is loaded from memory that is because it has been cached by the browser from your previous visits so it saves time and bandwitch to not re-download the data again.
Time
The time it takes the browser to download the file. This is usually a good indicator on what may be wrong. A quick glance at this column gives you a better understanding on how this website operates.
Waterfall
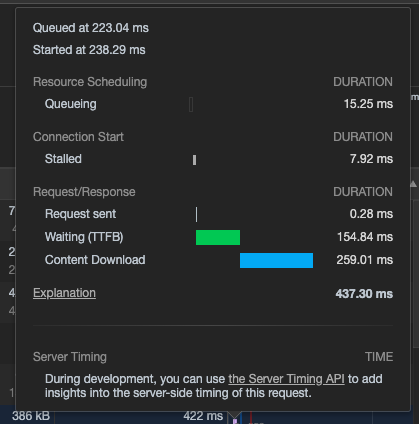
This shows you exactly what order the browser sends the request and how much time does it take in each stage in each download.

Hovering on the bar, it shows you information like how much it spends waiting in download queue, when server responds, and retrieving this response.
Additional Info

These data on the bottom of the dev tool is very helpful as well. It shows you how many requests the browser has fired so far, total bandwidth used, when DOMContentLoaded event fires as well as Load event.
What is taking so long?
Every website has their own metric so let's say most of the requests get fulfilled in 200 ms and maybe we have some assets that take longer than that. We check what file it is and we apply different optimization techniques. Most of the time it is usually an image because nowadays every website has these big and beautiful images trying to grab your attention so you don't bounce. You can check out my post on Serving Image at the Right Time for optimizing your images.
If it is JavaScript or CSS files, we can then check the download size. My rule of thumb is if each file is larger than 250 kb, then we should try to make it smaller. You can have your own metric but it is my default. We can then do the following inspections:
- Are the files being compressed like using GZIP
- Are we using CDN services to improve the respond time
- Are we shipping code that clients really need
If you are using Vue then you can check out How Not to Slow Your Vue App for more tips.
What are we downloading?
As mentioned before, by default requests are listed in the order of when they are fired in the network tab. As the engineer, we should have a general idea of what are important. If you have CSS files but they are downloaded way to late causing the page not showing anything at all then that is a problem.
If you see some anomalies like an image that users won't see unless scroll to the bottom of page is requested very early, we can check the initiator to inspect where and which method initiates the request.
Marketing team would do some tracking on the website to understand more about the customers. Google Tag Manager is a very good tool to incorporate that but we may end up having a lot of third-party libraries being downloaded that eventually slow down the site.
- Are we downloading too much upfront
- Are some assets necessary when first land on the page
- Can we defer some requests
- Are all of third-party libraries necessary are are they loaded too soon
How much are we downloading?
As mentioned in Protocol section we can know how these files are downloaded using which protocol. h2 has been proven to be a huge step-up from http 1.1 so configure your server and CDN to use h2 if you can control it. So you can download multiple files at the same time without waiting on each other. But you know everything needs a balance. Try tweaking webpack splitchunks and test for performance.
Bonus
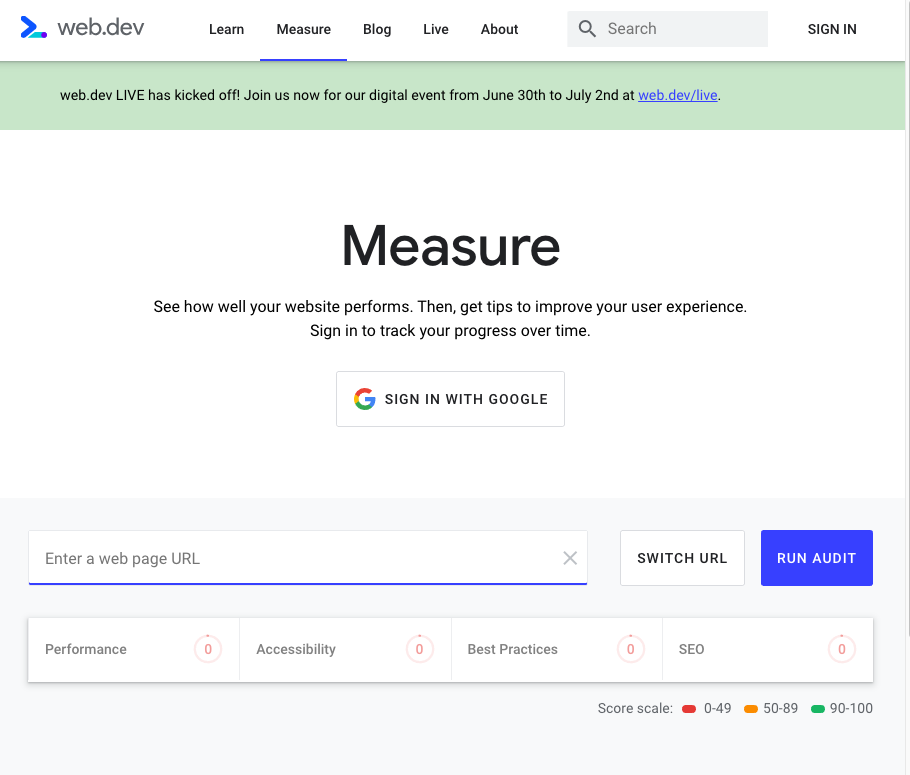
Google Chrome has a Lighthouse tab that can generate a performance report for your site. Or you can visit web.dev to do a measurement on any URL. It will give you some suggestions on what can be improved and tips on how to improve them as well.

If you find it helpful, please do me a favor and share with other people by tweeting this post so we can all browse the web much faster.